
Written by
Yuri ZhangSummary: This post exposes what the Resource Monitor of Windows is, including its traits and uses. It provides real-time data on CPU, memory, disk, and network usage, helping identify resource hogs.
Ever wondered what's going on under the hood of our Windows PC? When the computer slows down, fans start whirring like a jet engine, or an unknown process hogs your memory, we need more than just a surface-level glance at Task Manager.
That's where Resource Monitor comes in. It gives you detailed, actionable data that helps you take control. Let's explore how to access, use, and make the most of Resource Monitor in Windows.
Note: Resource Monitor, ideal for immediate monitoring of system resources on the fly, is user-friendly for quickly identifying resource bottlenecks or processes consuming excessive CPU/ memory/ network bandwidth.
Accessing Resource Monitor
The Resource Monitor is a built-in tool that doesn't require a separate download. You can quickly open or access it in a few different ways. Its shortcuts are comprised:
- Using the Run Command: Press Win + R, type resmon, and press Enter.
- Via Task Manager: Open Task Manager (Ctrl + Shift + Esc) → Performance tab → Click "Open Resource Monitor".
- Using Start Menu Search: Type "Resource Monitor" in the Start Menu search bar.
- Command Prompt or PowerShell: Type resmon in PowerShell or CMD and press Enter.
Share this and hope it turns you from a casual user into a system performance expert.
Using Resource Monitor for troubleshooting
One of the best uses of Resource Monitor is for troubleshooting system performance. Here's how you can use it to identify and solve common problems:
1. High CPU usage
If your computer is running slowly and you suspect high CPU usage is the issue, the CPU tab can help you pinpoint the culprit. You can see which processes are consuming the most CPU resources. If you find a resource-hungry process, you can either close it or investigate its cause further.
2. Memory leaks
Memory leaks occur when a program fails to release memory it no longer needs, which can cause system slowdowns or crashes. In the Memory tab, you can monitor the Hard Faults/sec and check if a process is consuming an excessive amount of memory. If you find a program causing a memory leak, closing or reinstalling it might help.
3. Disk bottlenecks
Slow disk performance can be caused by heavy disk usage. In the Disk tab, you can see which processes are causing high disk activity. If an application is constantly reading or writing to the disk, it could be the reason for a sluggish system. You can stop or optimize the application to improve performance.
4. Network issues
If you're experiencing slow Internet speeds, the Network tab can help identify the cause. You can monitor processes that are using network resources and see if any unexpected programs are consuming your bandwidth. If there's an issue, disconnecting or limiting the bandwidth of these processes can alleviate the problem.
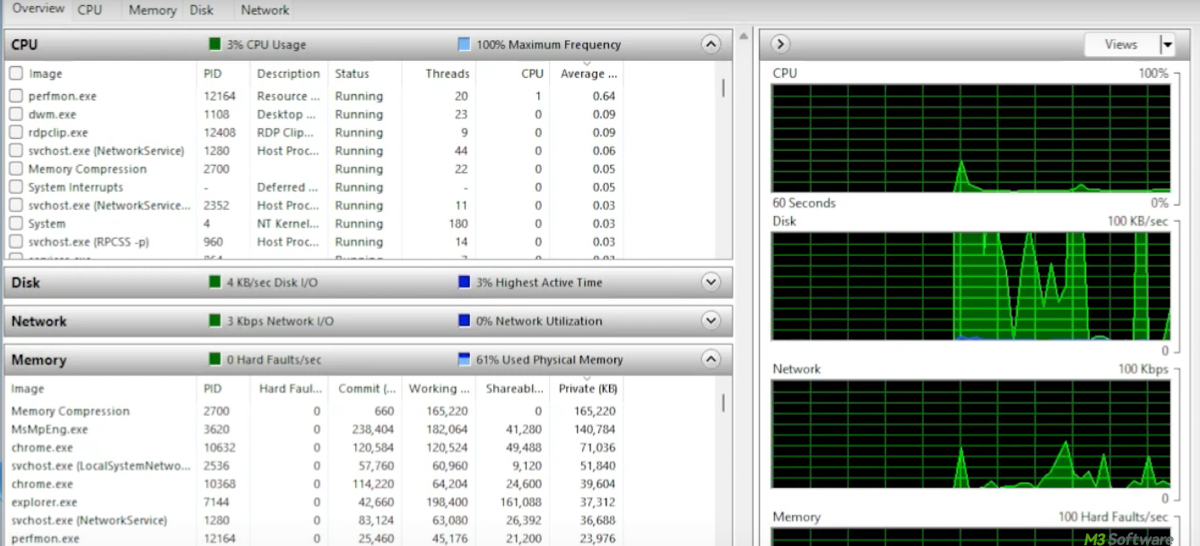
How to monitor Maximum Frequency in Resource Monitor
One specific feature of Resource Monitor is the Maximum Frequency. This feature shows the percentage of the CPU's maximum capability that is being utilized at a given time. It gives insight into whether the system is performing at its peak or if it's being throttled to save energy or reduce heat.
- 100% indicates the CPU is running at its base clock speed.
- Above 100% shows that Turbo Boost (or overclocking) is in effect.
- Below 100% indicates the CPU is in a power-saving mode or experiencing thermal throttling.

Resource Monitor vs. Performance Monitor
It seems distracting when you see Performance Monitor, which is also built into Windows. Here's a bit more detail about each:
Resource Monitor is focused on real-time data and provides an easy-to-understand interface that gives you instant feedback on your system's resource consumption. You can see which processes are consuming CPU, memory, disk, and network resources in real time, making it ideal for troubleshooting active system issues.
Performance Monitor, on the other hand, is a more advanced tool that collects detailed performance data over time. You can configure it to log system performance for extended periods, track specific metrics, and even set up alerts for performance thresholds. More suited for in-depth analysis, especially when diagnosing long-term system health.
Conclusion
Resource Monitor is invaluable for monitoring your system's performance. It helps you quickly identify and address issues without the need for advanced configuration. It also locates active processes and resource consumption. Pay attention to Maximum Frequency in Resource Monitor to understand if your CPU is performing optimally or being throttled.
Related articles:
What Is the Disk in Task Manager and What Does It Represent
Memory.dmp Unveiled: The Silent Witness to System Crashes
Windows Remote Assistance: A Quick Guide
Adding Widgets to Desktop in Windows 11 with Grace
Spread and use this tool, we'd love to see how it helps.